Summary: A Gantt chart is a visual timeline for tracking tasks and milestones throughout a project's lifecycle. It offers a high-level overview of project schedules, making it easier to manage complex plans involving multiple teams and shifting deadlines. By providing clear visibility, Gantt charts empower project managers and teams to stay organized and focused on achieving their goals together.
Whether you're managing sprints or long-term projects, this comprehensive guide explores what Gantt charts are, their practical applications, and the many benefits they offer.
What is a Gantt chart?
A Gantt chart is an agile project management tool used to plan and track the progress of various tasks and activities within a project. Serving as a visual timeline, it displays the list of tasks, their start and end dates, milestones, dependencies between tasks, and assignees.
As a valuable roadmap, a Gantt chart guides teams and organizations in effectively planning and coordinating their work items. By illustrating task interconnections, it fosters seamless collaboration and alignment among project stakeholders, ensuring everyone is on the same page and working towards the same goal.
The benefits of using Gantt charts
Gantt charts have two primary benefits.
Simplifies complex planning
Gantt charts make it easier to create complex plans, particularly those involving multiple teams and shifting deadlines. They also help teams schedule tasks around deadlines and allocate resources efficiently.
Enhances task scheduling and resource allocation
Project planners rely on Gantt charts for a high-level overview, showing key details like task start and end dates, milestones, and dependencies. Modern Gantt chart programs like Jira Timelines and Jira's Advanced Planning synthesize information and illustrate how choices impact deadlines.
Gantt chart components
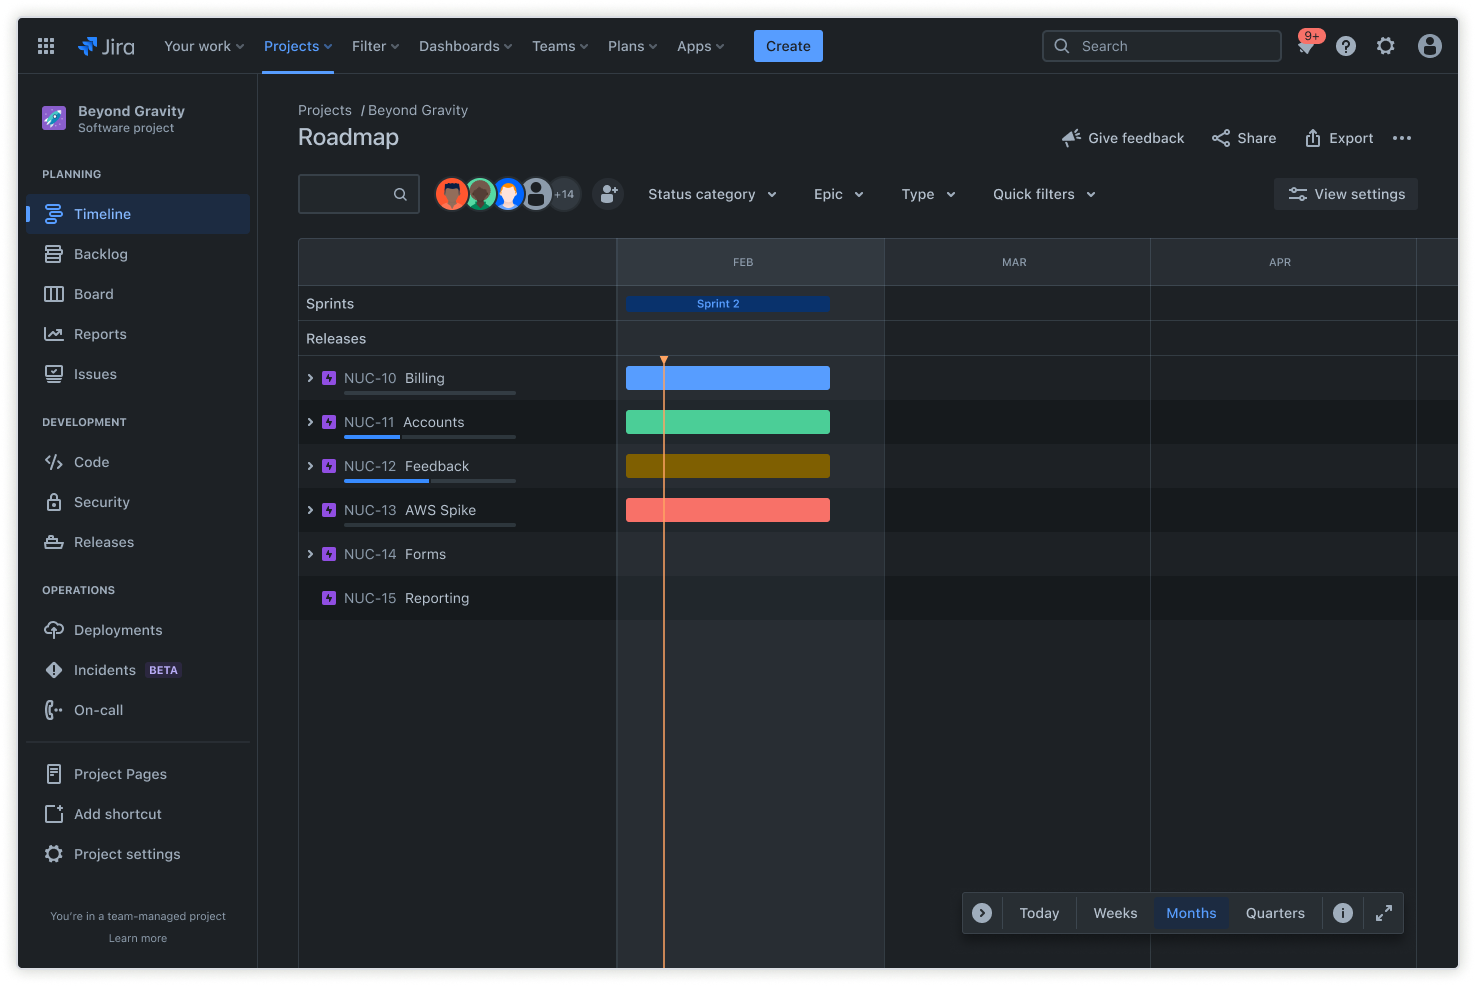
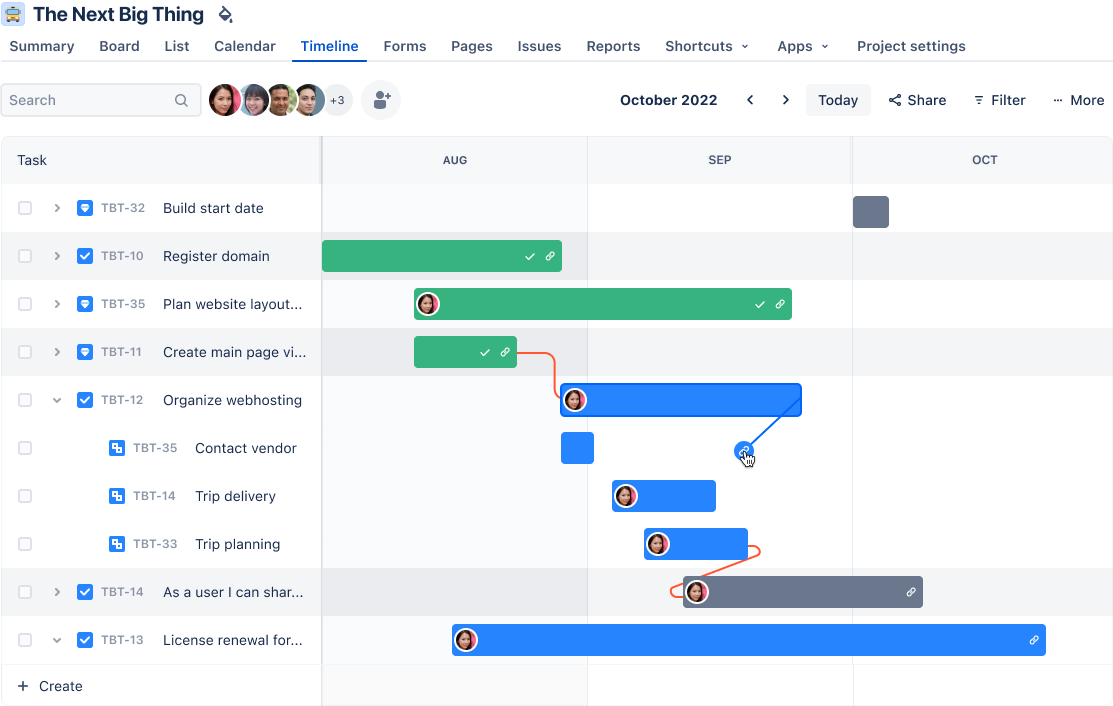
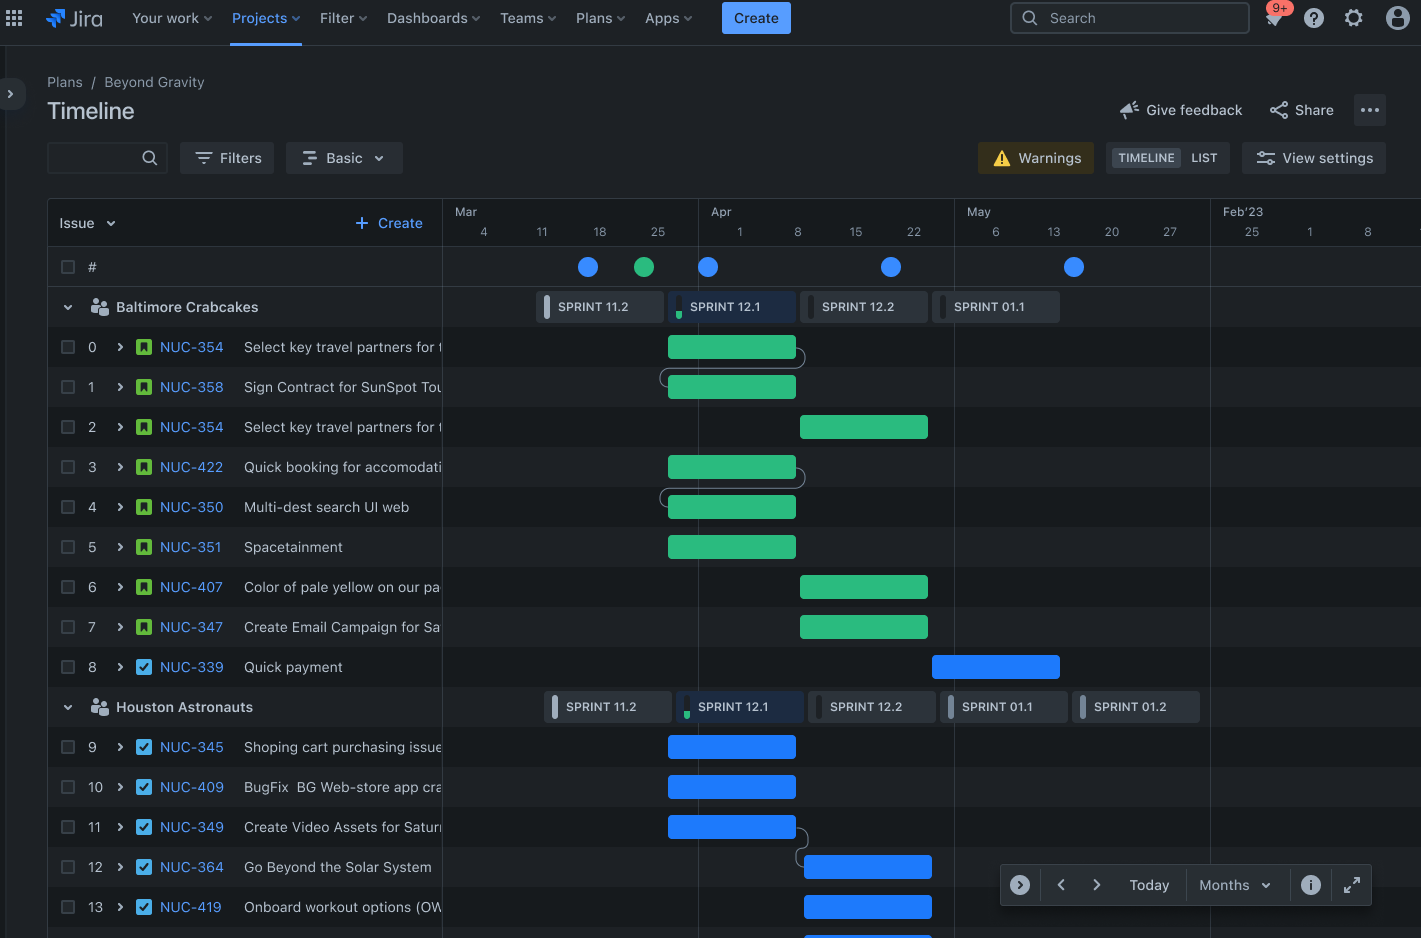
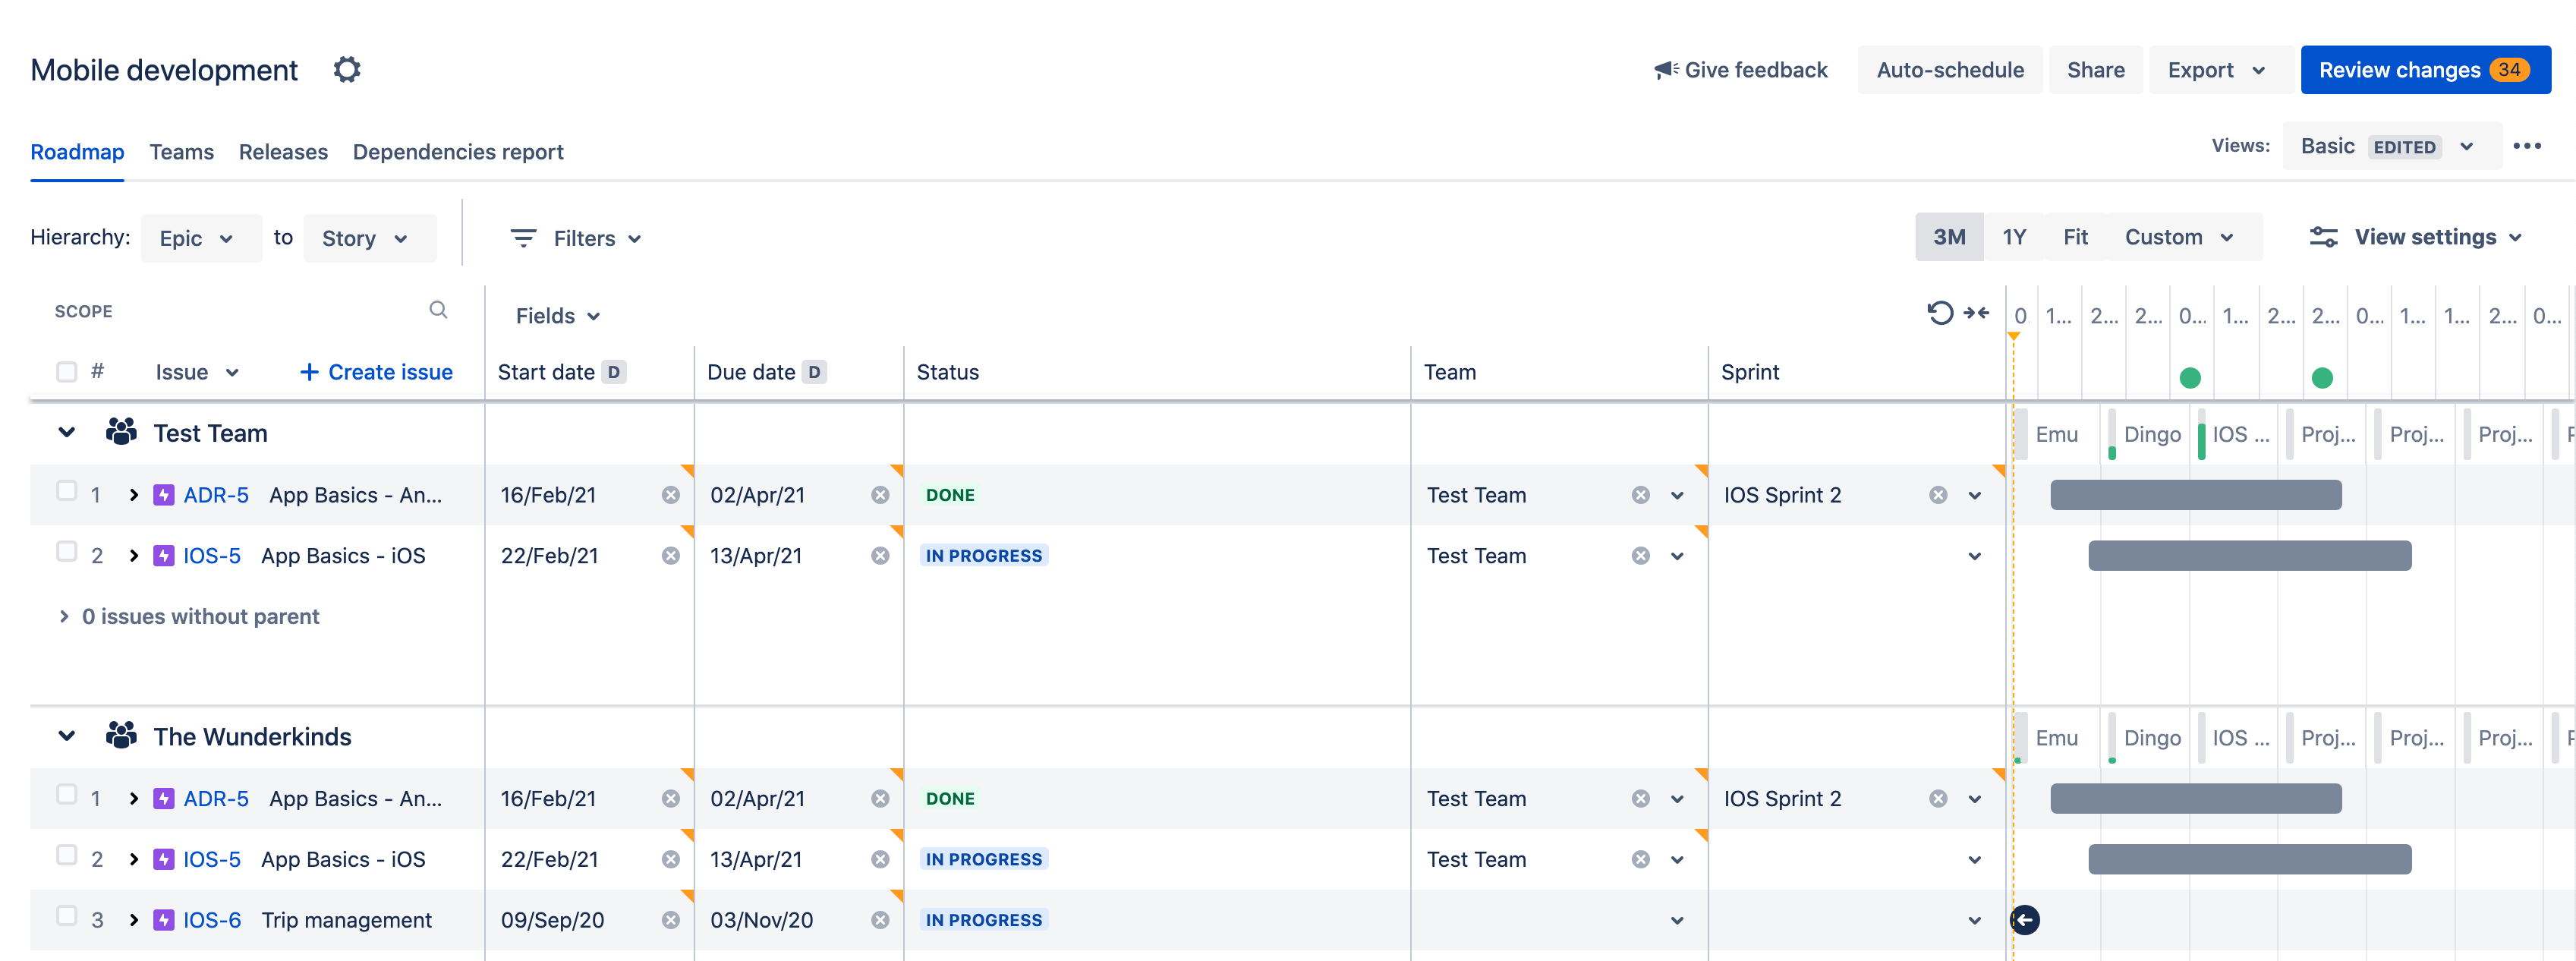
Gantt charts typically include two sections; the left side outlines a list of tasks, while the right side shows a project timeline with schedule bars that visualize work. Let's take a closer look at the primary components to look for in a Gantt chart.
Task list

A task list is a comprehensive list of all tasks required to complete the project. In Jira, tasks can be created and managed using the issue tracker, which allows you to assign tasks to team members, set priorities, and track progress. This ensures that every team member knows their responsibilities and deadlines, promoting accountability and efficiency. For example, a software development team uses the task list to assign coding, testing, and deployment tasks to different developers, ensuring a smooth workflow.
Timeline

The timeline is a visual representation of the project schedule, showing start and end dates at the top of the chart. Jira's Timeline feature provides a clear view of your project schedule, helping you visualize the sequence of tasks and their durations. Timelines help identify potential bottlenecks and allow for proactive adjustments to keep the project on track. For example, a marketing team uses the timeline to plan a product launch, ensuring all promotional activities are aligned and executed on time.
Dependencies

Links between tasks dictate the order of operations and show how tasks are related. Jira's Advanced Roadmaps allows you to set dependencies between tasks, ensuring that tasks are completed in the correct order and automatically adjusting schedules when changes occur. This prevents delays by ensuring that prerequisite tasks are completed before dependent tasks begin. In a construction project, for example, dependencies ensure that foundation work is completed before building the structure.
Milestones

Project milestones on Gantt charts are markers on the project timeline indicating major progress or completion of project phases. In Jira, you can mark key milestones using milestone markers, which help keep your team focused on critical deadlines and achievements. Milestones provide motivation and a sense of accomplishment, helping teams stay focused on long-term goals. A product development team sets a milestone for completing the prototype phase, signaling readiness for user testing.
What are Gantt charts used for?
Project managers use Gantt charts for three main reasons.
Build and manage a comprehensive project
Gantt charts visualize the building blocks of a project and organize it into smaller, more manageable tasks. The resulting tasks are on the Gantt chart’s timeline, along with dependencies between tasks, assignees, and milestones.
Determine logistics and task dependencies
Use Gantt charts to monitor a project’s logistics. Task dependencies ensure that a new task can only start once another task has finished. Delayed tasks result in automatic rescheduling. This can be especially useful when planning in a multi-team environment.
Monitor progress of a project
As teams log time toward work items in your plan, you can monitor the health of your projects and adjust as necessary. Your Gantt chart can include release dates, milestones, or other important metrics to track your project’s progress.
How to create a Gantt chart
With the benefits of Gantt charts in mind, let's explore how to translate your project plans into a clear and actionable chart. We'll cover the essential steps, from defining your project scope to tracking progress, to ensure your Gantt chart becomes a valuable tool for successful project execution.
Step 1: Define the project scope
The first step in creating a Gantt chart is to define the project scope. Start by identifying the project's main objectives. Clear objectives will guide the project and ensure that all tasks align with these goals throughout the project life cycle.
Once you have your objectives, outline the key deliverables. These are the tangible outcomes that you need to produce throughout the project.
Step 2: List all tasks and subtasks
Next, list every task necessary to complete each deliverable. Break large tasks into smaller subtasks to clearly show what your team needs to do. Identify each task, the team member responsible, and the required resources.
Step 3: Estimate task duration
Determine how long each task will take to complete. Be realistic, and consider any potential delays. Include buffer time in your schedule to accommodate unexpected delays and ensure the project remains on track.
Step 4: Determine task dependencies
Identify the task sequence. Some tasks can only start once others finish. Use dependency types such as finish-to-start or start-to-start to define relationships between tasks.
Step 5: Choose a Gantt chart tool
When choosing a Gantt chart tool, assess several factors to ensure the tool meets your project’s needs.
Jira is an excellent option for creating Gantt charts, particularly for software development teams. Tools such as Timelines and Plans help you create advanced roadmaps. These features support detailed task management, dependency tracking, and resource allocation. You can even use a Gantt chart template to streamline the process.
Step 6: Input data
Once you have all your information, input the data into your chosen tool. Enter all tasks and their corresponding durations into the Gantt chart. Set up dependencies between tasks to ensure the sequence is clear. Include key milestones to highlight significant points in the project timeline.
Best practices for creating effective Gantt charts
Creating an effective Gantt chart involves more than just inputting data. Here are some best practices to follow.
- Keep it simple and clear. Avoid cluttering your Gantt chart with too much information. Use colors and labels sparingly, and include only the most essential tasks and dependencies.
- Use color coding. Color coding helps visualize different task types or stages better. It enhances the timeline view and makes tracking progress at a glance easier.
- Communicate clearly. Ensure all team members understand the Gantt chart by using clear task descriptions, milestone markers, and dependency types. This will help avoid confusion and prevent mistakes.
- Share with team members and stakeholders. Share your Gantt chart with all relevant stakeholders to ensure alignment across the team. Keep everyone updated on any changes or revisions to the Gantt chart.
- Update the chart regularly. A Gantt chart should be a living, regularly updated document throughout the project. Make corresponding changes to keep the timeline accurate with each completed or delayed task.
-
Incorporate feedback. Seek feedback from your team regularly and incorporate it into your Gantt chart to improve accuracy and effectiveness.
How different stakeholders utilize Gantt charts
Gantt charts are versatile tools that cater to the diverse needs of various stakeholders within a project team. Here's how different roles utilize Gantt charts, the components they focus on, the questions they aim to answer, and the common challenges they face:
Project managers
Project managers use Gantt charts to oversee the entire project timeline, manage resources, and ensure deadlines are met.
Key questions: "Are we on track to meet our deadlines?" "What resources are needed at each phase?" "How do task dependencies affect the project timeline?"
Common challenges: As a project manager, juggling complex dependencies and resource allocation can be tricky. Jira's Advanced Roadmaps feature helps by automatically adjusting schedules when dependencies change and providing a clear view of resource allocation.
Team members
Team members focus on their specific tasks and dependencies to understand their role in the larger project. They interact most with the task list and timeline components to track their responsibilities and deadlines.
Key questions: "What tasks am I responsible for?" "What are the deadlines for my tasks?" "How do my tasks fit into the overall project?"
Common challenges: Managing tasks and tracking changes and dependencies can be constantly shifting. Jira's real-time collaboration and issue tracker features ensure team members are always updated on task changes or dependencies shifts.
Stakeholders
Stakeholders view high-level progress and milestones to stay informed about the project's status. They focus on milestones and visual aids to grasp the project's progress quickly.
Key questions: "What is the current status of the project?" "Have we reached key milestones?" "Are there any major risks or delays?"
Common challenges: When trying to understand complex project details, stakeholders can feel easily overwhelmed by information. Jira's customizable views and milestone markers provide stakeholders with a clear, high-level overview of the project, ensuring they are informed without being overwhelmed.
By leveraging Jira's robust features, each stakeholder can effectively use Gantt charts to meet their specific needs, ensuring a cohesive and well-managed project.
Key features of Gantt chart software
Gantt chart software, like Jira, offers advanced features to enhance project management efficiency and effectiveness. Here's why these features are essential:
Automatic scheduling
This feature automatically adjusts timelines when task dependencies change, ensuring your project plan remains accurate and up-to-date. It saves time and reduces the risk of human error, allowing project managers to focus on strategic planning rather than manual updates.
Resource management
Efficient resource allocation is crucial for project success. Effective resource management features help distribute tasks and resources across teams, optimizing workload and preventing burnout. This ensures that all team members are utilized effectively, contributing to a balanced and productive work environment.
Real-time collaboration
With real-time collaboration, team members can update progress and communicate changes instantly. This feature fosters transparency and keeps everyone aligned, reducing miscommunication and enhancing team cohesion. It is particularly beneficial for remote teams or projects with tight deadlines.
Customizable views
Different projects require different perspectives. Jira offers customizable views, such as daily, weekly, or monthly timelines, to suit various planning needs. This flexibility allows project managers to tailor their Gantt charts to specific project requirements, improving clarity and focus.
Integrations and compatibility
Gantt chart tools are most effective when they integrate seamlessly with other project management software and platforms. Jira excels in this area by offering robust integrations with tools like Trello and BigPicture. These integrations enable smooth project management across different systems, enhancing collaboration and efficiency.
By incorporating these features and integrations, Jira is a comprehensive solution for modern project management needs.
How to use Gantt charts in Jira
Jira has two road mapping features, each with a slightly different focus. Jira’s Timelines tracks work assigned to a single team, while Plans specializes in larger, cross-company project planning.
Project-specific charts: Jira Timelines
The screenshot below, taken from Timelines, shows a project-specific Gantt chart commonly used at the team level or within a single group. The chart shows how the team is tracking toward its goals, and the collapsible work breakdown structure allows project managers to get a bird’s-eye view of the project’s crucial stories. Jira has a free project management template that includes Gantt charts.

High-level organization chart: Plans
Jira’s Plans offer quick and easy planning that helps teams better manage their dependencies and track real-time progress on the big picture. These project- or team-level roadmaps are useful for team-level planning of large pieces of work.
For planning, managing, and tracking work across multiple teams or even your entire company, Plans empowers teams at scale.

Programs designed with cross-team workflows offer more advanced tools, such as capacity management and automatic scheduling features, to help create more complex plans. They also offer a variety of view settings, which allow you to customize your Gantt chart to highlight a certain aspect of your plan when presenting.
Elevate your project management with Jira's Gantt charts
Transform your project management approach with the power of Gantt charts in Jira. These visual timelines are not just about tracking tasks—they're about achieving your project goals precisely and clearly. By leveraging Jira's robust features, you can create Gantt charts that are efficient and pivotal in steering your projects toward success.
Jira seamlessly integrates with various Gantt chart tools, providing a holistic project tracking and management solution. This integration ensures that your project timelines are always up-to-date, allowing real-time adjustments and insights.
Harness the full potential of Jira's capabilities to manage your Gantt charts effectively. With real-time updates, customizable dashboards, and advanced reporting, Jira empowers you to keep your projects on track and your team aligned.
Are you ready to revolutionize your project management strategy?
